When we set out to build a data team at MarTrust, we wanted to move from analysts working in siloes on Excel-based reports, into a single, strategic data function that drives value across the business.
Today, data drives how we run quarterly planning, work with our customers and track our OKRs. Team members save on average 90 minutes per week as a result, and we have automated complex processes like billing, reconciliation and contact management.
Data has become a central part in MarTrust’s financial, operational and product processes. Analysts now have more time to dig into the “why” behind the numbers, and search for growth opportunities. As we recruit for a new Head of Data, I wanted to write down the thinking and lessons behind our journey, so that our next Head of Data knows how we got here.
Step One: Creating the Data Team
Our first step was to create the data team and give it a mission to enable data to flow freely inside MarTrust, empower all teams to be data-driven, and for data analysts to focus the “why” behind the numbers.
We brought the various data people into a centralised, fully remote, team to get this done. There’s now five of us in the data team and we own everything from data pipelines to end-user dashboards.

Some members have a technical profile, and others have an business analysts background. But in the data team, everyone is trained to be able to support on all parts of the stack. We often rotate ownership of key parts of our domain to make sure everyone continues learning. We’ve found that AI is a great way to upskill, and that a small team can get more done today than ever before.
To enable self-serve, and avoid the team becoming a bottle-neck, we introduced the idea of an extended team of “data champions”. The data champions receive additional training from the data team and they in turn provide training and support in their teams.
Step Two: Setting Up the Data Infrastructure
The next step was to set up the data infrastructure with the following principles:
- The data warehouse is primarily for reporting. Engineering owns building operational tooling.
- Data should be self-serve, and everyone should as much access as possible.
- Sensitive data requires strong control and limited access.
- It should be cost efficient (both headcount and infrastructure)
- We want to see results quickly.
With these principles in mind, we selected tools that we could run without dedicated data engineering resource.
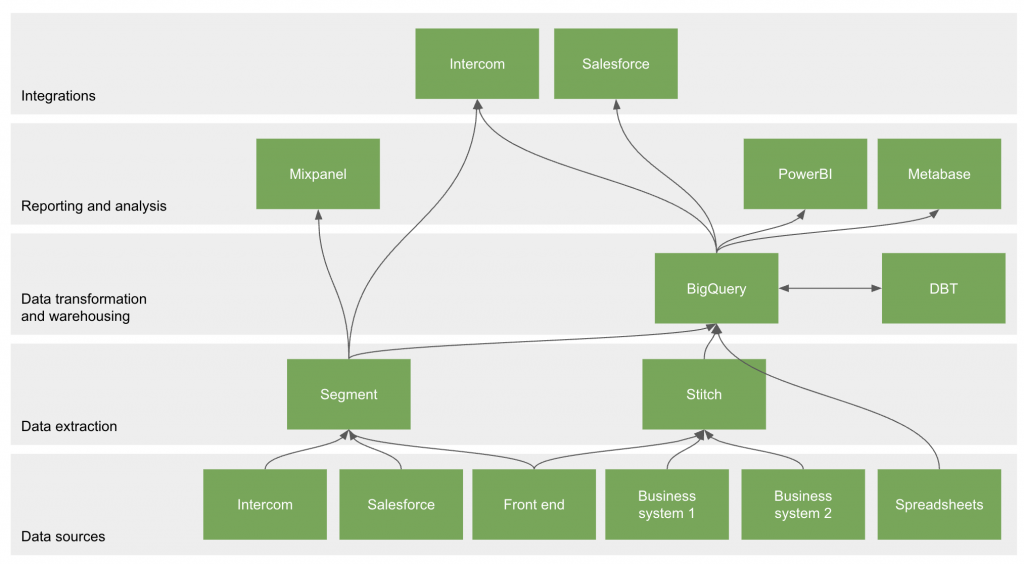
We selected tools that are affordable yet powerful. Bigquery is both easy to use thanks and comparatively cheap, enabling us to save on both headcount and infrastructure. We initially wrote models directly in GitHub, but migrated to dbt for better testing and dependency management, opting for a “hard cutover” to avoid technical debt.
For BI, Metabase stood out for its feature completeness and cost-effectiveness. All employees have developer access, and dashboards are used across teams weekly.
Here’s what the cost of our data stack looks like:
| Tool | Annual cost |
| BigQuery | $13,200 |
| Stitch + Fivetran | $12,000 |
| dbt | $10,400 |
| Metabase | $14,000 |
| Segment | $5,000 |
| Mixpanel | $1,680 |
| Total | $56,280 |
Step Three: Driving a Cultural Shift
Technology alone doesn’t create a data-driven culture — behavior change does.
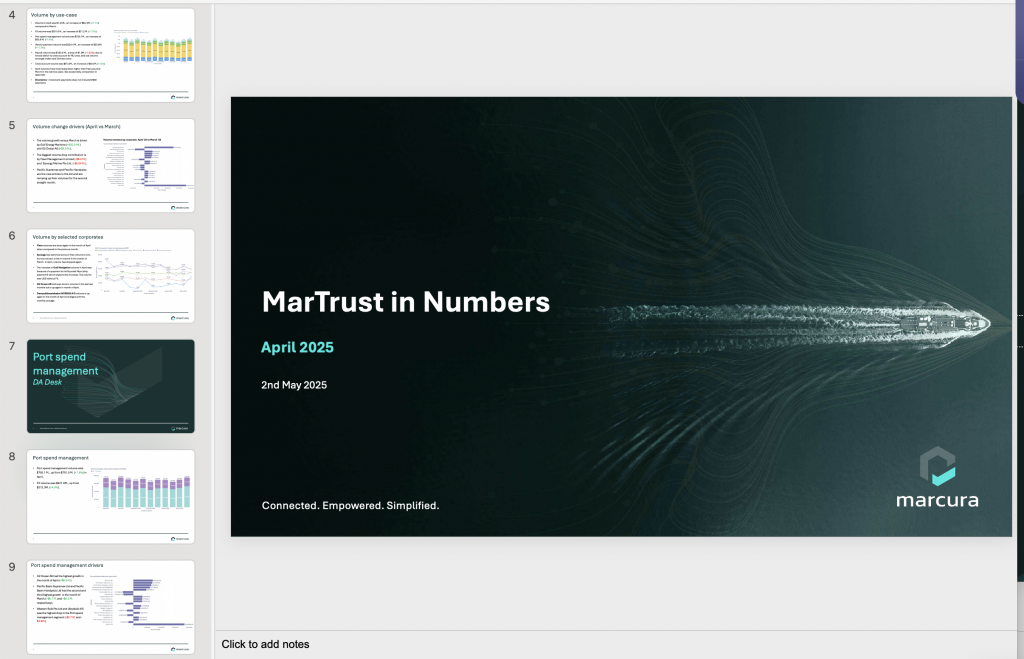
We launched MarTrust in Numbers, a monthly report and dashboard package inspired by Wise’s approach to internal reporting and engaged with the leadership team around forming the right data narrative. It summarizes core metrics and provides accessible context and insights.
To manage ad-hoc requests and support operational teams, we introduced a rotating “on-call” analyst role. Each week, one team member owns:
- Answering inbound data questions via a public Teams channel
- Monitoring data pipelines and alerts
- Supporting urgent business needs
- Acting as team secretary
This structure reduces risk of overwork, distributes the workload, and builds resilience.
We also implemented weekly sprint planning and retrospectives in addition to our quarterly OKRs to keep momentum high and adjust quickly.
The results
Within the first month, we delivered our first dashboards with live data. A year in, here’s what we achieved:
- Employees save on average 90 minutes per week. 70% of employees use Metabase on a weekly basis.
- A fully operational data warehouse with 75% test coverage that keeps our production systems, Salesforce, Intercom and Hubspot in sync.
- A BI environment that is both powerful and simple to use. Everyone uses it to self-serve data, and more technically minded team members create their own dashboards and join the data champions program.
- Our monthly reporting pack enables in-depth conversation around company performance in the leadership team.
“Operations use the dashboards daily.”
— Vanessa Gouveia, Payment Operations Officer
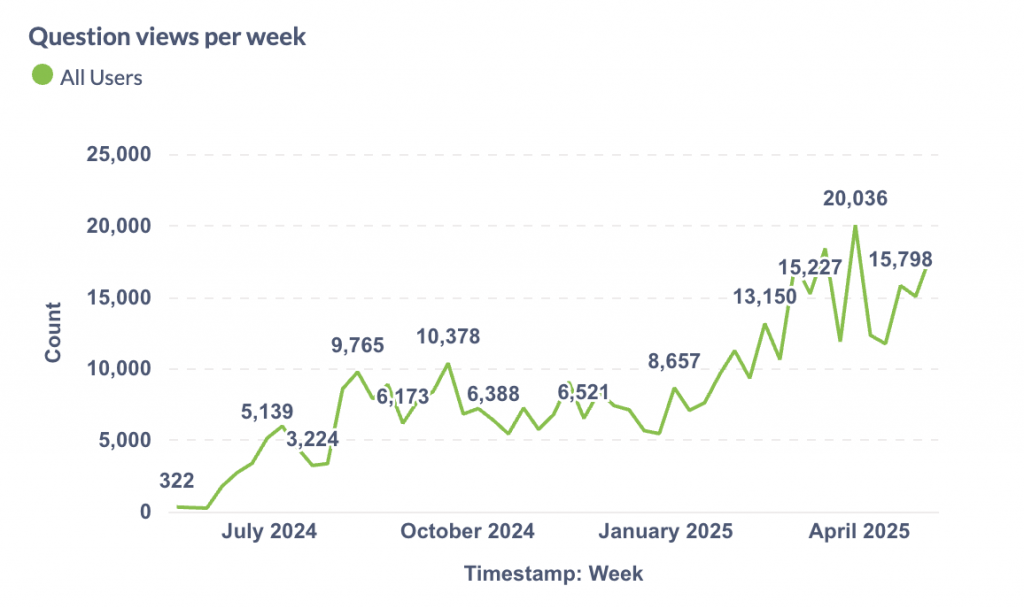
Since launching Metabase, dashboard usage and user adoption have steadily increased, validating our investment in access and enablement.
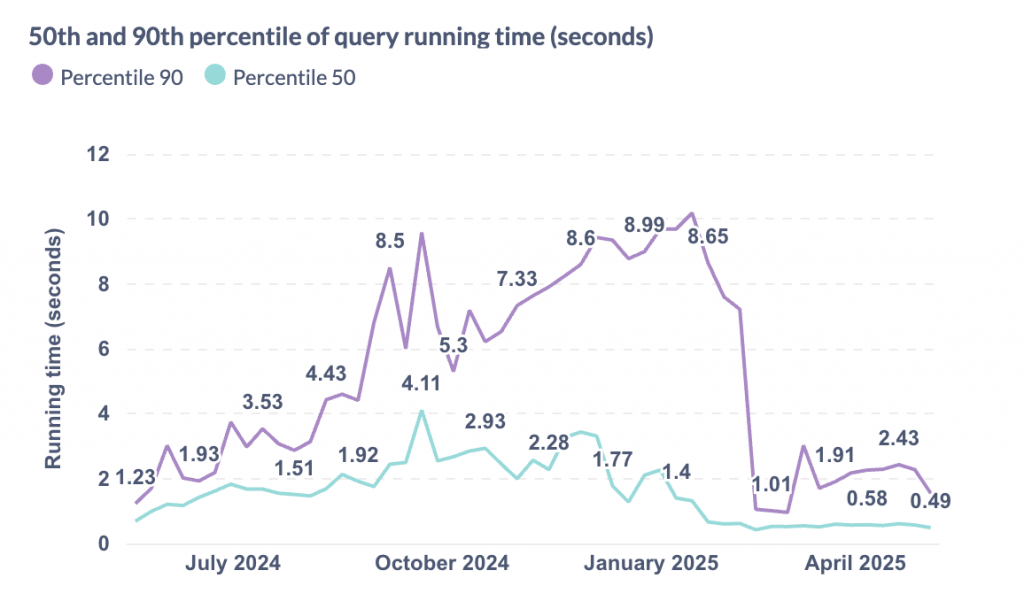
After migrating to dbt in early 2025, we also saw significant improvements in dashboard load times and overall platform reliability.
With dbt, we have also been able to add test coverage on all of our models, which greatly has increased reliability and our ability to refactor models.
We decided to obfuscate all sensitive data at the database level, making it easy for us to provide access to the whole company, while we can offer plain-text access on a case-by-case basis.
Besides the data infrastructure, process automation and dashboards, we also prepare an in-depth data pack each month called “MarTrust in Numbers”. This monthly report contains a summary of the main dashboard that is available in Metabase, along with analysis on the drivers behind the numbers.
What’s next?
Following the success of MarTrust’s data team, the Marcura group has decided to run a similar initiative. As I step into this new role, I’m hiring a new Head of Data for MarTrust to take our team and platform to the next level. We’re looking for someone excited to scale impact, lead with empathy, and help shape the next chapter of a modern fintech data function.
Leave a Reply